We've compiled a list of commonly asked questions to provide you with a better understanding of our Longitudinal Knowledge Assessment (LKA®) Specialty Knowledge Gaps Annual Reports and their significance.
Why are bars used to indicate performance rather than a specific percent of correct items?
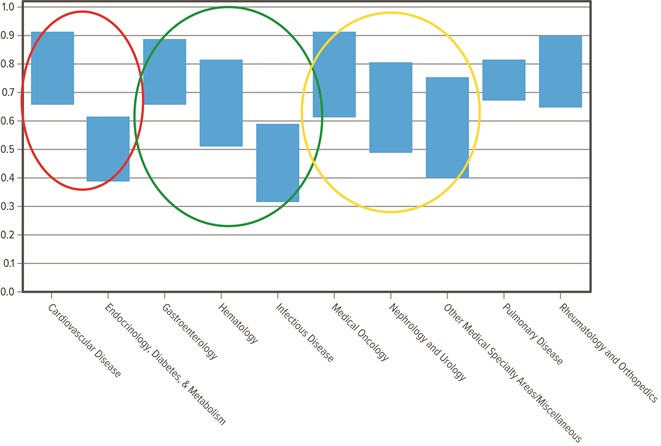
The interval for each bar is derived from the standard error for that particular demographic. In other words, each bar centers on the average percent correct for the given demographic, with the interval determined by the standard error (a measure of precision) which is added to and subtracted from the average. Bigger bars have a larger standard error and are therefore less reliable than smaller bars. If the height of two bars overlaps, we cannot conclude definitively that there was a significant difference in the performance of physicians for that demographic. If the height of two bars does not overlap, we can conclude that the performance differences, according to these demographics, are statistically significant.
This example graph shows:
- In the red circle, Cardiovascular Disease is statistically significantly easier than Endocrinology.
- In the green circle, Gastroenterology is statistically significantly easier than Infectious Disease, but Gastroenterology is not significantly different from Hematology, and Hematology is not significantly different from Infectious Disease.
- In the yellow circle, Medical Oncology, Nephrology, and Other Medical Specialty Areas show that none of these content areas are significantly different from each other.
Why are some bars very large and others are not?
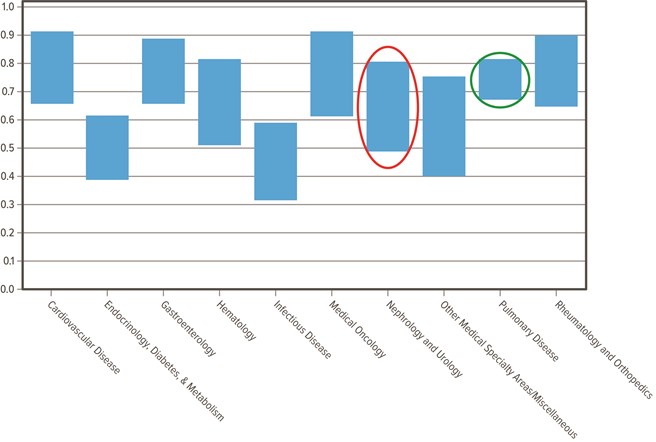
Categories that are represented by very small numbers (sparse data) may result in larger standard errors which are often less reliable than data represented by large numbers.
This example graph shows:
- Nephrology and Urology (red circle) is an example of a larger standard error (less reliable)
- Pulmonary Disease (green circle) is an example of a smaller standard error (more reliable)
What is equating?
Equating is a statistical process used to convert scores from different examinations to a common score scale for purposes of comparability and equivalence. ABIM does not compute equated scores for medical content area scores—only for overall scores.
Why are there more top-level blueprint areas on the content outline than there are blueprint areas in the charts?
For reporting purposes, smaller top-level blueprint areas are combined with other similar blueprint areas in order to provide more meaningful and stable information.
Which geographic region is my state in?
U.S. Census Bureau classifications for region have been used to identify physicians in the Northeast, Midwest, South and West. You can view which states are included in each region on the U.S. Census Bureau's website.
How are the tasks for the multiple-choice questions defined?
Each question on the examination falls into a specific blueprint area and tests a specific cognitive task. Definitions for the tasks can be found in the content outline for the MOC exam. Please note that not every discipline incorporates tasks in its respective MOC blueprint.
What is an assessment blueprint?
A blueprint is a table of specifications that determines the content of each assessment. It is developed by the Approval Committee for each discipline and reviewed annually. The discipline's Specialty Board or Advisory Committee must also approve the exam blueprint. The blueprint is based on analyses of current practices and understanding of the relative importance of the clinical problems in the specialty area. The blueprint also includes the target percentage of questions from each primary medical content category on the assessment. This ensures appropriate and equal representation of the content categories between assessment administrations. Changes to the composition in the blueprint usually follow trends in current practice. Read more about ABIM's assessment process.
How much performance data are included in the report?
The Specialty Knowledge Gaps Reports are based on up to three years of performance data. Each physician can respond to up to 80 live items per year. Over time more items will be included in the reports and can provide more accurate and reliable information.
Where can I find more information about the LKA?
You can learn more about the LKA by visiting our dedicated LKA website.